
It is easiest to measure what is visible right away: logins, clicks, time spent on the platform, completed modules, and quiz scores. That is why many organizations finish their training analysis right there.
However, there is a difference between LMS activity and real learning. And completing a course does not always mean that the participant has acquired knowledge and will apply it in their job. So, how do we measure the real impact of training on an organization? We answer this question in this article using professional methods of learning analytics for e-learning.
Why does interpreting advanced analytics in e-learning software make it difficult for organizations to assess training effectiveness?
Assessing training effectiveness often looks simple only at the beginning. The platform shows reports, charts, quiz scores, and completion statuses. However, in our work with clients, we see that the problem begins when we need to answer a much harder question: did this training actually change anything in people’s work?
It is easiest to measure activity. The LMS will show who completed the training, how much time they spent in the course, what their test score was, and whether they returned to the materials. This is necessary e-learning analytics data because it helps to see whether the participants went through the learning process at all and where they might have stopped. However, even advanced analytics in e-learning software does not automatically tell us whether the employee used the new knowledge after closing the course.
This is exactly where many organizations fall into a trap. Course completion starts to be treated as proof of effectiveness. Yet, a salesperson might pass a test on knowledge of a new product but still not introduce it into conversations with customers. A customer service employee may know a new procedure but, under time pressure, revert to old habits.
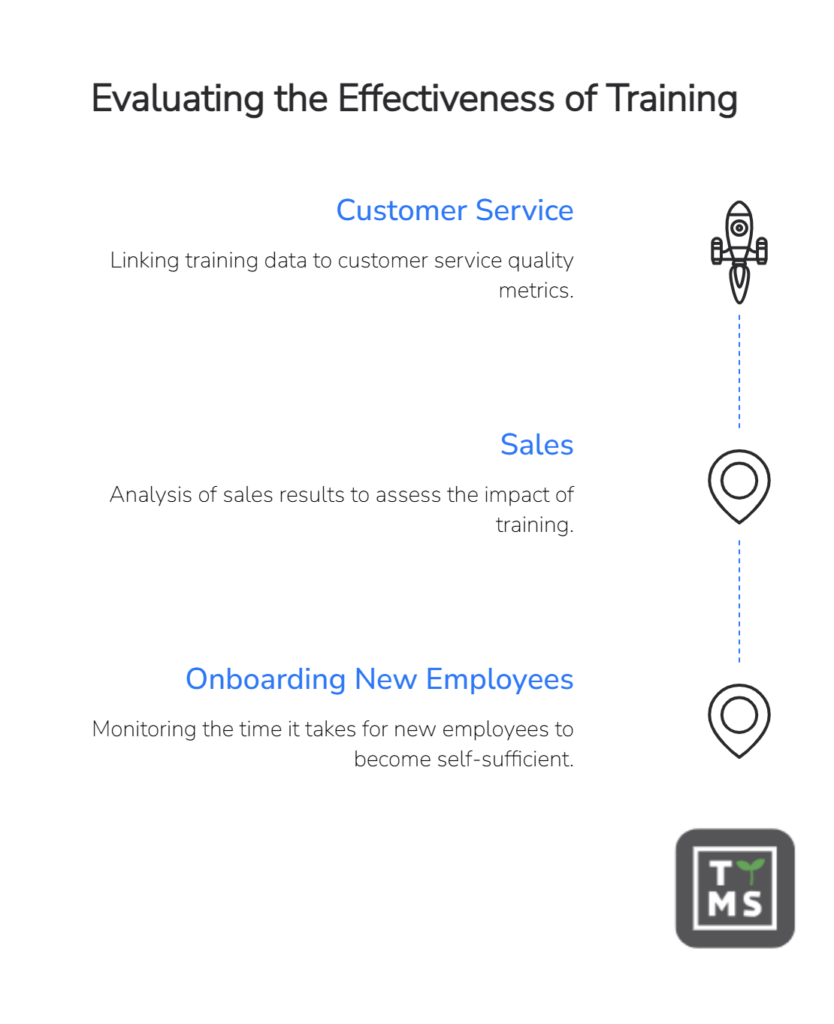
It is even more difficult to show the impact of training on business. Here, LMS data analytics alone are no longer enough. You need to combine them with what is happening in the organization: sales results, customer satisfaction, the number of operational errors, onboarding time for new employees, or the level of compliance with procedures. Only such a combination of data allows you to check whether the training translated into real change.
2. The Kirkpatrick Model in e-learning analytics. How to use it in practice?
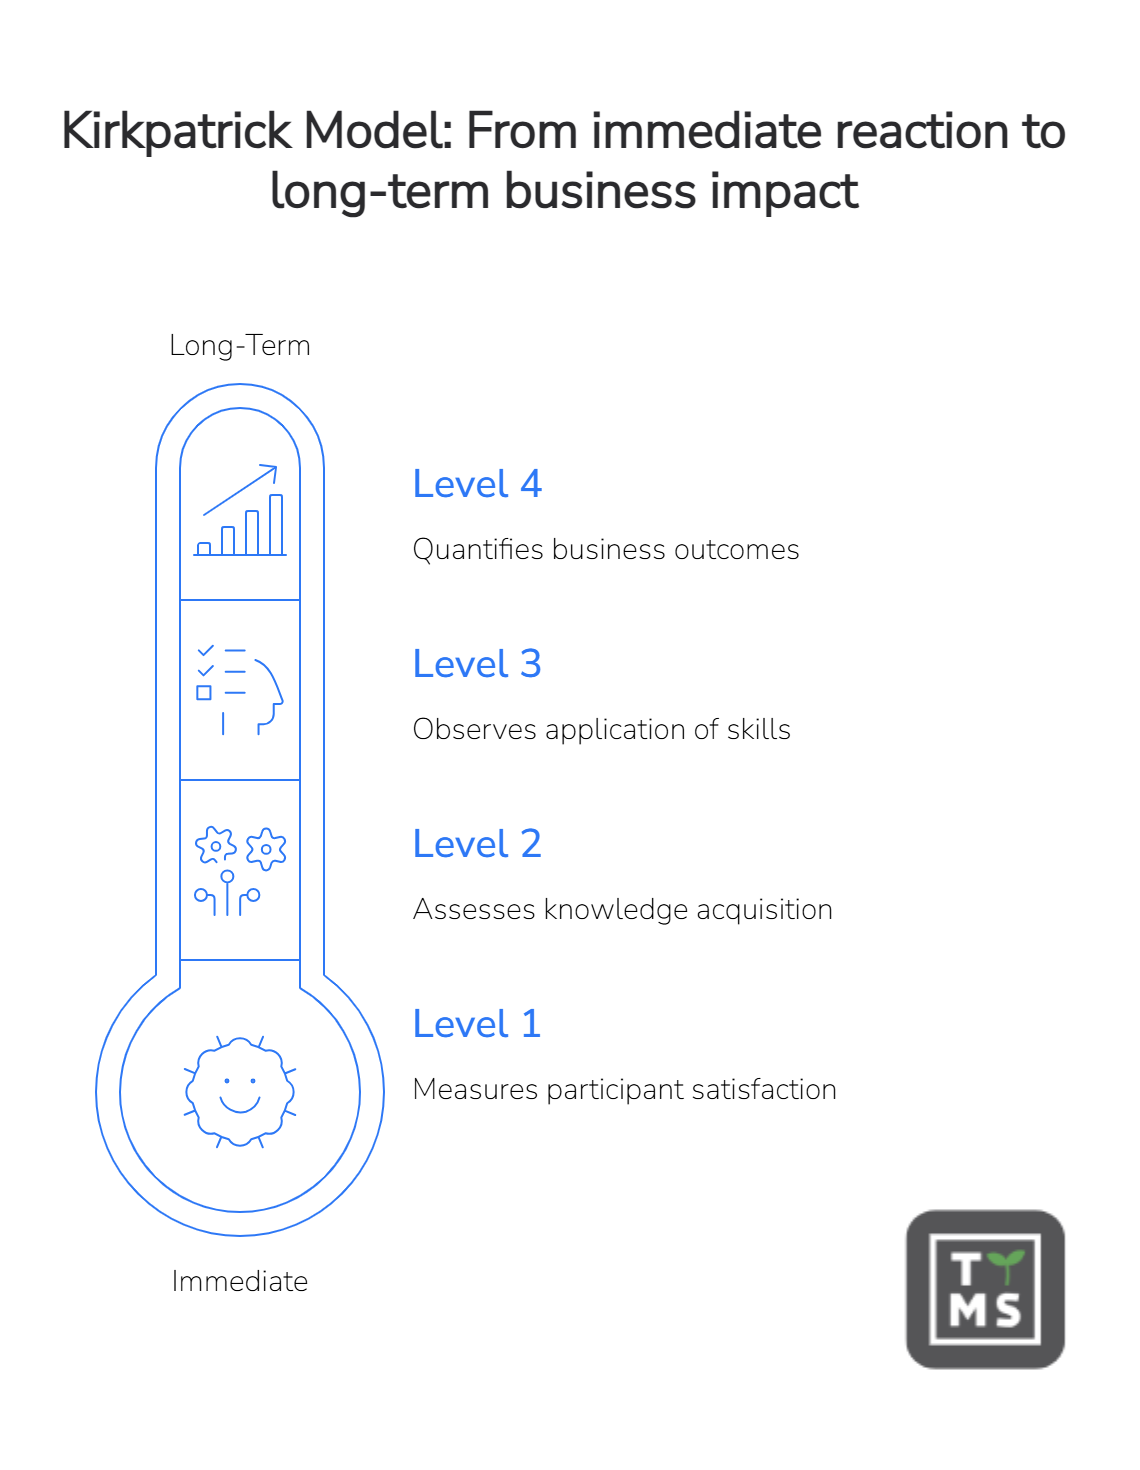
In assessing the effectiveness of training, the Kirkpatrick Model is often used. Implementing the Kirkpatrick model is the foundation on which professional data analytics e-learning processes are based. It helps to structure thinking: from participant reaction, through learning, behavior change, all the way to business results. And it clearly shows why “course completed” alone is not enough if an organization wants to know whether e-learning really works.
In practice, it is worth planning the measurement method even before the training begins. Thanks to this, the organization knows from the very start what data it will collect and what effects it wants to achieve.
At the first level, participant reactions can be measured using short satisfaction surveys. At the second level, knowledge is checked – most often through tests, quizzes, or practical tasks completed after the course.
The third level requires observing what happens after the training. Depending on the topic, this could involve conversations with supervisors, work quality analysis, evaluation of new skills, or comparing results before and after the training. This is precisely where organizations most often discover that a high test score does not always translate into a change in behavior.
The fourth level focuses on business results. For onboarding, this could be the time to reach independence, the number of errors, or the completion of the onboarding path. In compliance training, the level of adherence to procedures, audit results, or the number of incidents are often analyzed. In sales, it might be the results of salespeople and the use of product knowledge in customer conversations, and in customer service, the level of customer satisfaction and the time to resolve inquiries.
From our experience, organizations achieve the best results when they do not limit themselves to a single metric. Combining data from LMS with analytics, behavioral observations, and business metrics provides a much more complete picture of training effectiveness than a test score or course completion rate alone, showcasing the true power of corporate e-learning analytics.
| Kirkpatrick Level | What do we measure? | Example metrics | Key question |
| 1. Reaction | How participants received the training | satisfaction survey, usefulness rating, participant feedback | Was the training clear and useful to them? |
| 2. Learning | What the participants learned | test score, quiz, practical task, certificate | Did the participant actually acquire new knowledge or skills? |
| 3. Behavior | Whether participants apply knowledge at work | supervisor observation, work quality, number of errors, feedback conversations | Is the employee doing something differently after the training? |
| 4. Results | What is the impact on business | sales, onboarding time, customer satisfaction, compliance with procedures, number of incidents | Did the training bring a real benefit to the organization? |
One of the most common mistakes is treating the LMS report as a complete answer to the question of training effectiveness. If we look exclusively at course completion, test scores, or time spent on the platform, we only see participant activity and not a real change in their work.
Without referencing the assumed training objectives to the employee’s performance before and after the training, it is difficult to assess whether the program actually improved skills. In practice, this means that LMS data should be contrasted with supervisor observation, the quality of tasks performed, the number of errors, employee independence, or other metrics linked to the training goal.
The simplest way to enrich such an analysis is through post-training surveys delayed in time. A question asked a week, a month, or a quarter after the training often says more than a survey completed immediately after the course. Only then can you check whether the knowledge was used in practice, rather than just memorized for the sake of the test, using advanced e-learning data analytics.
Norbert Kulski Head of BI & Automation Solutions | TTMS
3. What statistics do most e-learning platforms provide and what do they measure?
Modern LMS platforms allow you to track dozens of different performance indicators. The problem is that not all of them say the same about the actual results of learning. It is worth knowing which data are truly valuable and how to interpret them correctly with the help of professional e-learning analytics.
3.1 Completion Rate
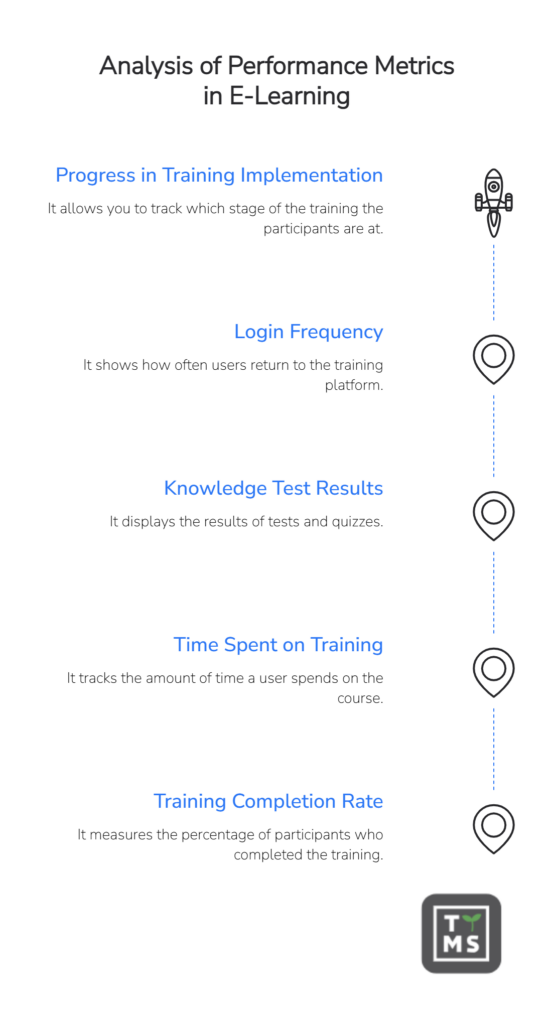
The Completion Rate shows what percentage of participants completed the training.
It is one of the most frequently monitored metrics because it is simple to measure and allows for a quick assessment of participant engagement. If a large portion of users do not finish the course, it may indicate problems with the training’s length, difficulty level, or attractiveness.
At the same time, a high Completion Rate does not automatically mean that the training was effective. A participant may complete a course solely because it is required by the organization. The mere fact of clicking the “Complete” button says nothing about whether they acquired new competencies and are using them at work.
3.2 Time Spent
Time Spent measures the time spent by a user in the course.
At first glance, it may seem that the more time a participant dedicated to the training, the more they learned. In practice, this metric can be highly misleading.
A long duration does not always mean active learning. A user might leave a browser tab open while performing other duties, take a coffee break, or get distracted from the training by other tasks. On the other hand, a very short time does not necessarily indicate a problem – an experienced employee may go through the material quickly because they already know some of the topics.
Therefore, Time Spent is worth analyzing only in combination with other metrics.
3.3 Quiz Scores
Quiz Scores show the results of tests and knowledge checks.
This is one of the best ways to assess whether a participant has retained key information from the training. Test results also help identify areas that require additional explanation or improvement of materials.
However, it is important to remember that a high test score does not always mean acquiring competence. A participant might memorize the correct answers to questions but have difficulty applying this knowledge in a real-world professional situation. Therefore, tests are best at verifying knowledge, not actual behavior change.
3.4 Login Frequency
Login Frequency shows how often users return to the training platform.
Regular logging in can indicate participant engagement and that the training serves as a source of knowledge used in their daily work. This is a particularly valuable metric for development programs, competence academies, or knowledge bases.
However, the login frequency metric itself does not show what the user did after logging in. Frequent visits do not always mean active learning, just as less frequent logins do not have to mean a lack of interest.
3.5 Course Progress
Course Progress allows you to track which stage of the training participants are currently at.
This is one of the most practical metrics for instructional designers. Thanks to it, you can quickly spot the places where users most often drop out of learning or lose interest.
If the majority of participants drop out in the same module, it is worth analyzing its length, difficulty level, way of presenting content, or quality of interactions. Such data often allow for the detection of problems that satisfaction surveys or test results do not show.
From our experience, analyzing participant drop-out points is one of the fastest ways to improve the quality of existing courses and increase the effectiveness of the entire development program using LMS data analytics.
Norbert Kulski Head of BI & Automation Solutions | TTMS
| Metric | What does it show? | What is worth remembering? |
| Completion Rate | Whether the participant completed the course | Training completion does not yet mean that the participant has acquired competencies or changed their way of working. |
| Time Spent | How much time the user spent in the course | A long time in the course can mean learning, but also an open tab, a break, or a lack of concentration. |
| Quiz Scores | What results the participant achieved in tests | A high test score shows information retention, but not always the ability to apply it in practice. |
| Login Frequency | How often the user returns to the platform | Frequent logins can indicate engagement, but they do not show the quality of learning. |
| Course Progress | What stage of the course the participants are at | The most valuable are the places where users stop learning – that is often where the real problems of the course are visible. |
4. E-Learning Analytics – what is the difference between learning analysis and activity reporting?
Many organizations today use reports available in LMS platforms. Thanks to them, you can quickly check who completed the training, how much time they spent on the course, or what score they achieved in the test. The problem is that these are primarily descriptive data that show what happened. Proper analysis of LMS platform data must go beyond simple reports.
The answer to this is learning analytics for e-learning, which goes a step further. Instead of focusing solely on numbers, it helps understand the reasons behind specific behaviors and discover patterns that can affect learning effectiveness.
You could say that the LMS answers the question “what happened?”, while e-learning analytics helps answer the question “why did it happen?”.
For example, a report alone might show that 30% of participants did not complete the training. E-learning analytics, however, allows you to check where users drop out most frequently, what content causes them difficulty, and whether the problem stems from the course design, the difficulty level of the material, or the way the knowledge is presented.
In practice, training data analysis should lead to asking questions that help improve the learning process:
- Which modules cause the participants the most difficulty?
- Which test questions most frequently result in errors?
- At what stage do users most often interrupt the training?
- Which materials do they return to repeatedly?
- Which content is skipped or scrolled through the fastest?
- Which elements of the course best support knowledge retention?
Effective reporting in e-learning requires going beyond standard LMS data.
From our experience, the greatest value comes not from simply collecting data, but from using it for continuous training improvement. Even minor changes in places where users encounter difficulties can significantly improve the effectiveness of the entire development program.
Norbert Kulski Head of BI & Automation Solutions | TTMS
| Reporting in LMS | E-Learning Analytics |
| Shows what happened | Helps understand why it happened |
| Who completed the training? | Why did some participants not complete the training? |
| What was the test score? | Why do participants make errors in specific areas? |
| How much time was spent in the course? | Which elements of the course engage, and which cause dropouts? |
| How often do users log in? | Which materials are actually being used at work? |
| Historical data | Conclusions leading to training optimization |
| Measuring activity | Improving the learning process |
I see the greatest value in training data when it stops serving a purely reporting function and begins to support course development. By analyzing the points where participants most frequently stop learning, make mistakes, or return to specific materials, we can very quickly identify elements that need improvement.
From an e-learning design perspective, this rarely means having to rebuild the entire course. More often, precise adjustments are enough: simplifying a selected module, adding a practical example, shortening a lesson that is too long, or changing the form of interaction. Such decisions are worth making based on actual data, rather than on intuition alone.
The most effective organizations treat training as solutions that constantly evolve. Each subsequent edition of a course provides new information, allowing them to systematically increase its effectiveness and better respond to the needs of the participants.
Mikołaj Korzeniowski E-learning Tech Lead at TTMS | Product Owner of AI4E-learning
5. Measuring completion rate is not enough.
For years, researchers studying learning processes have pointed out that the ease of learning can be misleading. Robert Bjork, a professor of psychology and author of the concept of desirable difficulties, showed that conditions that make learning seem easy and fluid often lead to poorer long-term knowledge retention.
A good example is mathematics exercises. If we solve only one type of task for an hour, by the end of the class we might feel that the material has been mastered. Both the teacher and the students see rapid progress. However, when the test takes place a few weeks later, the results are often disappointing.
Research shows that better results are achieved by interleaving different types of tasks, even though participants make more mistakes during learning and feel it is more difficult. Paradoxically, this extra effort leads to more permanent retention and more effective use of knowledge in the future.
This is an important lesson for e-learning creators too. A training course that is fast, easy, and hassle-free to complete will not always be the most effective. Sometimes, greater value is delivered by a course that requires active thinking, decision-making, problem-solving, or recalling previously acquired knowledge.
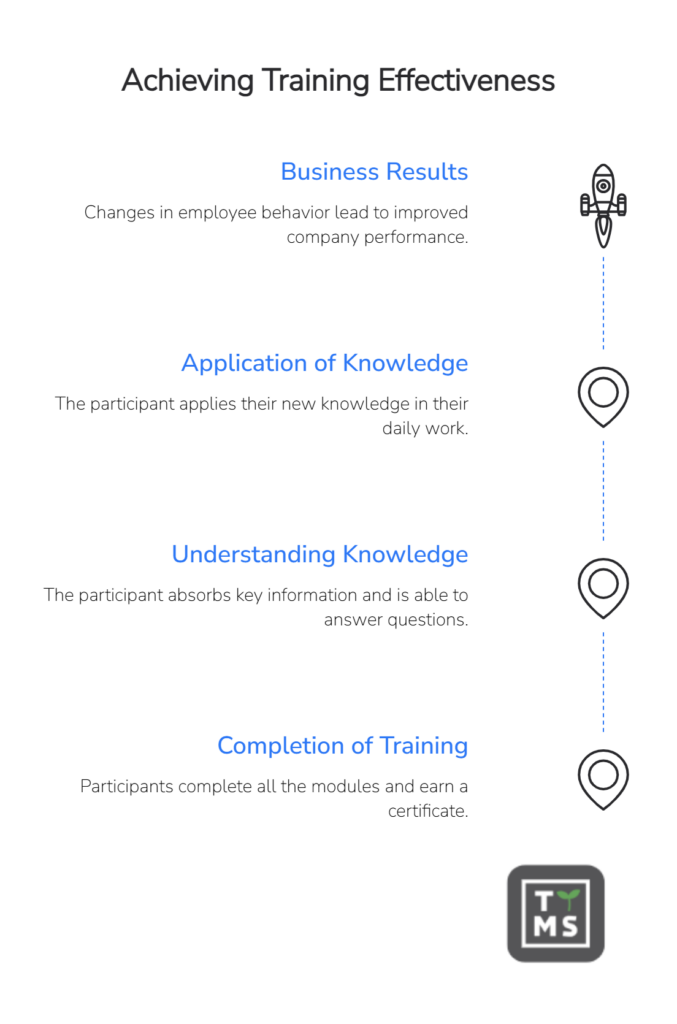
Therefore, it is worth keeping in mind the three levels of training effectiveness (Kirkpatrick Model) in relation to the course completion rate:
- Completion does not mean understanding
A participant can go through all modules and obtain a certificate without absorbing key information. - Understanding does not mean application
An employee can answer test questions correctly but fail to use the new knowledge during their daily work. - Application does not yet mean a business result
Even if employee behavior changes, the organization still needs to check whether this translated into better sales, higher service quality, fewer errors, or other expected results.
This is exactly why the best organizations do not stop at completion rate analysis, but instead investigate the metrics of e-learning analytics much more thoroughly. They treat it as a starting point, not proof of training effectiveness. Real value only appears when participant activity data is combined with information on behavior change and business outcomes.
| Learning Analytics Myth | Reality |
| A high completion rate means effective training. | The completion rate only shows participant activity. |
| High test scores guarantee behavior change. | Knowledge does not always translate into action. |
| Behavior change automatically improves company performance. | Business impact requires additional measurement and analysis. |
| A single metric can evaluate training effectiveness. | Effectiveness must be analyzed on multiple levels simultaneously. |
6. SCORM limitations and xAPI (Experience API) capabilities in training process analysis
For many years, SCORM was the standard in the e-learning world. It allowed organizations to check basic information about participant progress: who completed the training, what test score they achieved, or how much time they spent in the course.
The problem is that modern learning is increasingly less likely to take place solely within an LMS. Employees watch instructional videos, use knowledge bases, participate in webinars, perform practical tasks, learn in mobile apps, and collaborate with other employees. Traditional SCORM was not designed to track such activities.
In practice, SCORM primarily answers the question:
“Did the participant complete the training?”
On the other hand, more and more organizations want to know:
- How did the participant learn outside the LMS?
- Which materials did they return to?
- Which resources do they use in their daily work?
- What actions do they perform after completing the training?
- Is the knowledge still being used after several weeks or months?
It is precisely for these needs that the xAPI (Experience API) standard, also known as Tin Can API, was developed.
| SCORM | xAPI |
| Tracks primarily activity within the LMS course | Tracks activity across the entire learning ecosystem |
| Course completion | Every learning experience |
| Test results | User behaviors |
| Time spent in the course | Use of materials after training |
| Limited to LMS | Data from LMS, apps, webinars, simulations, and other sources |
| Answers the question “what happened?” | Helps analyze “how does the learning process occur?” |
6.1 How does xAPI work?
xAPI is based on a simple model of logging user experiences.
Every action is recorded in the format of:
“Someone did something.”
For example:
- Anna completed the onboarding course.
- Tomasz watched the instructional video.
- Karolina solved the sales scenario.
- Michał downloaded the safety procedure.
- Ewa participated in the webinar.
This information is sent to a special data repository called a Learning Record Store (LRS), which can collect data from many different sources, not just a single LMS.
6.2 What data can be collected thanks to xAPI?
The greatest advantage of xAPI is the ability to track the entire learning path rather than just activities inside a course.
For instance, an organization can analyze:
- watching training videos,
- using the knowledge base,
- downloading documents and procedures,
- participating in webinars,
- activity in mobile applications,
- performing simulations and scenarios,
- training game results,
- participation in classroom workshops,
- implementing onboarding tasks,
- using supporting materials after training is completed.
This makes it possible not only to measure course completion but also to analyze actual learning-related behaviors.
6.3 Why does this matter for Learning Analytics?
If the LMS primarily shows what happened in the course, xAPI allows you to observe the entire learning process. The organization can check which materials are most frequently used, which resources employees return to over time, and which activities actually support competency development.
This is exactly why xAPI is often seen as one of the foundations of modern e-learning analytics. It allows you to move from simple course completion reporting to the analysis of participants’ actual educational experiences.
xAPI Data Examples
| Activity | Example |
| Watching a video | User watched 80% video |
| Simulation | User selected incorrect response |
| Knowledge base | User searched procedure |
| Mobile app | User completed microlearning |
7. What metrics for e-learning analysis are truly worth monitoring?
Metrics available on the LMS platform alone rarely allow you to assess the actual effectiveness of training. Information about course completion, the number of logins, user activity, or quiz scores is valuable, but only combining it with other business data allows you to understand whether the training delivered the expected results.
7.1 In the case of onboarding new employees, the most important metric is the time to reach independence
A lot depends on the goal of the training and the organizational area it concerns. For example, if a course was prepared as part of onboarding new employees, the HR department will be interested in more than just whether the participant completed all modules. Much more important information will be the moment when the newly hired person reaches independence and no longer requires constant support from a supervisor or more experienced colleagues. It is this moment that shows when the employee begins to bring full value to the organization.
7.2 In sales, training effectiveness should be evaluated through the lens of business results
The analysis of training data in sales looks completely different. Let’s assume that the sales department has completed training on a new product. All indicators available in the LMS look perfect: employees viewed all materials, actively used the knowledge base, completed the training, took part in simulations, and achieved high test scores.
At this stage, we can only state that the participants went through the training process. This does not automatically mean, however, that the training was effective.
Only combining LMS data analytics with sales results allows you to assess its real impact. Among other things, it is worth checking whether sales representatives offer the new product to customers more often, whether the number of closed deals has increased, whether sales value has improved, and whether employees can use product knowledge during sales calls.
Such a comparison of data can lead to very different conclusions. If training activity was high but product sales did not increase, the problem may lie in the training itself, the way knowledge was transferred, or in the sales process. If, on the other hand, the best salespeople achieve high results both in training and in sales, the organization can identify practices that are worth spreading across the entire team. It is also possible to detect individuals who perform well in tests but have difficulty using knowledge in practice, which may point to the need for additional exercises or manager support.
7.3 In customer service, training data should be combined with service quality metrics
Similar dependencies can be observed in customer service departments. In this case, training data is worth contrasting with metrics such as average handle time, the number of first-contact resolutions, or customer satisfaction levels. Only combining this information allows you to assess whether the training translated into improved service quality and team efficiency.
Learning analytics, therefore, is not about analyzing single metrics in isolation from the context. Its goal is to combine training data with actual business results and find the answer to the most important question: did the training affect the way participants work and the results achieved by the organization?
| Training area | Metrics worth combining with LMS data |
| Onboarding | time to reach independence, number of errors made by the new employee, onboarding path completion |
| Compliance | level of compliance with procedures, knowledge test results, number of incidents or violations after training |
| Sales | sales representatives’ results, number of offers or transactions for a given product, use of product knowledge in customer conversations |
| Customer service | customer satisfaction level, ticket resolution time, number of issues resolved at first contact |
From an analytical perspective, the most valuable metrics are those that can be directly linked to the training goal and the business outcome. The shorter the path between training and a measurable effect, the easier it is to assess the actual value of the development program.
Norbert Kulski Head of BI & Automation Solutions | TTMS
8. Artificial intelligence and the future of e-learning analytics
Traditional training reports primarily show what has already happened: who completed the course, what score they achieved, how much time they spent in a module, and where they stopped learning. This is important data, but organizations increasingly need something more. They want to know not only what happened, but also what might happen next.
This is exactly where AI is beginning to change the way we think about e-learning analytics. Instead of analyzing solely the past, it can help predict risks and point out areas that require support. We describe this in more detail in our article “How to Measure E-learning Training Effectiveness with AI? Every CLO Should Know This”, in which we show why training data should be connected with business goals and competency development.
In practice, AI can help answer questions that were previously difficult to capture in standard reports:
- which participants are likely to drop out of the training,
- which modules cause the most issues,
- at which points users make errors most frequently,
- which competencies require additional support,
- which groups of employees need a different learning path,
- whether the training can translate into specific business metrics.
8.1 What does AI bring to training analytics?
The greatest value of AI is not that it generates another report. Its strength lies in detecting patterns that a human might not notice right away. If the system sees that participants from a specific department often stop in the same module, achieve lower scores on similar questions, and return to the materials less frequently, this could be a sign that the problem does not lie in engagement, but in the training design or a mismatch in the difficulty level.
AI can also support the personalization of learning paths. A participant who struggles with a given topic can receive additional materials, shorter reviews, practical exercises, or an alternative module. On the other hand, someone who quickly mastered the basics does not have to go through all the content at the same pace as the rest of the group.
This is particularly important in larger organizations, where a single training path rarely fits all employees. A new hire in onboarding needs different data and support than a sales representative learning about a new product, or an employee undergoing mandatory compliance training.
From our experience, AI in e-learning analytics works best when it does not replace human decisions but helps make them faster and based on better data. The system can point out a risk, a pattern, or a competency gap. The ultimate interpretation should still belong to the L&D team, managers, and those responsible for employee development.
Traditional Reporting vs. AI-supported E-Learning Analytics
| Area | Traditional Reporting | Learning Analytics with AI |
| Data approach | Shows what happened in the course | Helps predict what might happen next |
| Training completion | Informs who completed the course | Can indicate who is at risk of dropping out |
| Course issues | Shows scores and progress | Helps detect modules that cause difficulties |
| Competency gaps | Often visible only after test results | Can be identified earlier based on behavioral patterns |
| Learning path | The same for all participants | Can be personalized to the level and needs of the user |
| Human role | Analyzes the report after the training is completed | Interprets AI recommendations and makes development decisions |
TTMS Expert Commentary:
Today, the concept of AI covers much more than generative artificial intelligence. In the context of learning analytics for e-learning, solutions in the area of data science and machine learning also play a huge role, as they can analyze large datasets and detect relationships that are difficult to notice during traditional report analysis.
In practice, this means the ability to identify anomalies and predict problems before they affect the effectiveness of the training program. The system can indicate groups of participants at risk of not completing the course, detect modules that consistently cause difficulty, or identify behavioral patterns pointing to competency gaps. Thanks to this, the organization is not limited to analyzing the past, but can react faster and continuously improve both the training content and the entire process of employee development.
Norbert Kulski Head of BI & Automation Solutions | TTMS
9. Summary – Analyzing training data with AI
E-learning analytics is much more than analyzing reports from an LMS platform. The mere fact of completing a training course, a high test score, or frequent logins to the system are not yet proof of an effective learning process.
The biggest challenge for organizations is moving from measuring activity to measuring the real impact of training on employee behavior and business results. This is precisely why models such as Kirkpatrick, more advanced data collection standards like xAPI, and solutions using artificial intelligence are gaining more importance.
From our experience, the most valuable organizations do not only ask “was the training completed?”. They ask much more difficult questions: what did the participants learn, how do they apply this knowledge at work, and does the training contribute to achieving business goals?
Data alone does not improve training quality. Value only appears when an organization can translate insights from e-learning data analytics into concrete actions: improving content, changing learning paths, providing better support to participants, and creating more effective development programs.
In the coming years, the role of corporate e-learning analytics will likely continue to grow. Thanks to AI, organizations understand better and better not only what happened during training, but also what actions are worth taking to increase learning efficiency and develop employee competencies faster.
| Key Conclusion | What does it mean in practice? |
| Completion rate is not enough | Course completion does not mean acquiring competence. |
| Learning Analytics is not reporting | The most important thing is to understand the reasons behind participant behaviors. |
| Knowledge does not always translate into action | A high test score does not guarantee behavioral change at work. |
| Training data should be combined with business KPIs | Only then can the real impact of the training be evaluated. |
| AI helps predict, not just report | It becomes possible to detect risks, competency gaps, and training needs earlier. |

10. How TTMS helps organizations measure training effectiveness?
At TTMS, we help organizations not only create e-learning courses but also better understand whether they actually work. We combine experience in instructional design, data analytics e-learning, and the deployment of AI-based solutions to support companies at every stage of the process: from material preparation, through course publishing, to outcomes analysis.
Our solutions allow for the transformation of corporate knowledge, documentation, procedures, and expert materials into online courses, and then the analysis of participant progress, test results, and engagement data. Thanks to this, organizations can quickly notice which content works well, where participants face difficulties, and which areas require additional support.
In practice, this means moving from the simple question “did the employee complete the training?” to much more important questions: did they understand the material, can they use the knowledge at work, and does the training support the business goals of the organization?
By combining e-learning, LMS data analytics, and AI, we help companies design training programs that do not end with a certificate but realistically support competency development, onboarding, compliance, sales, and customer service.
FAQ
What is learning analytics for e-learning?
Learning analytics for e-learning is the measurement, collection, analysis, and reporting of data about learners and their contexts. Unlike traditional LMS activity reporting—which only tells you what happened (e.g., who completed a course)—learning analytics focuses on understanding why it happened. It connects learning experiences with behavioral changes and business KPIs to continuously optimize the training process and improve organizational performance.
What is the difference between LMS reporting and e-learning analytics (Learning Analytics)?
LMS reporting lets you see “what happened” (e.g., who completed the course, what the test score was), while advanced e-learning data analytics helps you understand “why” it happened. Thanks to these analytics, you’ll not only find out that participants didn’t complete the training, but also where the problem occurred and how to optimize the content to increase its effectiveness.
Is the SCORM standard sufficient for modern e-learning analytics?
SCORM is sufficient for tracking basic activity within the LMS platform (completion, test scores). However, to measure the actual impact of training on the organization and track the learning process outside the system (e.g., webinars, working with a knowledge base, simulations), the xAPI standard is essential. It allows for the recording of every employee’s learning experience in one place.
How can you link e-learning data to a company’s business results?
Effective training process analytics requires aligning data from the LMS with your organization’s specific KPIs—such as sales results, customer service levels, or onboarding time. This transforms training from merely a “requirement” into a measurable tool that supports the company’s actual business goals.
How does artificial intelligence support the analysis of training processes?
AI is transforming analytics from reactive to predictive. Instead of analyzing only historical data, artificial intelligence can detect behavioral patterns that humans overlook. Among other things, it can identify groups of participants at risk of dropping out, pinpoint skill gaps before they arise, or personalize training paths by tailoring them to the level of difficulty an employee is facing.