In most companies today, data is everywhere: in CRM, ERP, financial systems or marketing tools. The problem is usually not the lack of them, but the fact that it is difficult to quickly answer a simple question: “what actually happens in business?”. However, access to data alone is not enough to make the right decisions. The biggest challenge is to translate them into concrete conclusions and actions. This is where Business Intelligence (BI) reporting helps.
BI reporting has ceased to be the domain of IT departments only and has become one of the key competencies of modern organizations. Whether you’re a CFO analyzing quarterly performance or a marketing manager evaluating campaign performance, BI reports provide a structured, transparent, and actionable view of your data. With clear visualizations and analytics, they allow you to spot trends, identify problems, and make better business decisions faster – much more effectively than traditional spreadsheets.
1. What is BI reporting?
BI reporting is about transforming raw, distributed operational data into clear insights that support fact-based decisions. It’s a structured process that involves pulling data from multiple sources, modeling it, and presenting it in the form of reports and analytics dashboards that are available to different teams in the organization.
At TTMS, we look at Business Intelligence reporting not just as a technical task, but as a comprehensive analytical capability of an organization. It involves integrating data from multiple systems, building a semantic data model, ensuring proper management and security, and then sharing reports across workspaces, applications, and embedded analytics. The goal remains the same: to help organizations monitor performance, identify trends, and respond quickly to changes using up-to-date information instead of static spreadsheets.
BI reports can take various forms: from management dashboards, through operational reports, to detailed analyses supporting specific areas of the business. They help teams at every level of the organization better understand what’s going on, why it happened, and what actions are worth taking next.
2. BI Reporting vs. Traditional Reporting: How Are You Different
Traditional reporting usually focuses on the analysis of historical data. The data is exported from the system, organized in a spreadsheet, and then made available as a static file showing the situation at a specific point in time. By the time the team takes action on it, the information may already be out of date.
BI reporting works differently. Instead of relying on isolated data sets, a BI system integrates information from multiple sources into one consistent, regularly refreshed model. Users can access up-to-date reports, apply filters, drill down into detailed data, and analyze information on their own without waiting for a new IT statement.
This shift from passively receiving reports to actively exploring data is changing the way organizations work with information. The data becomes not only a summary of what has already happened, but a real support in making faster and more accurate decisions.
3. BI Reporting vs Business Intelligence: Where the Line Lies
BI reporting and business intelligence are often used interchangeably, but they don’t mean exactly the same thing. BI reporting is primarily descriptive and diagnostic. It helps answer the questions: “what happened?” and “why did this happen?”, presenting historical and current data in a readable, structured form.
Business analytics goes one step further. It also includes predictive and prescriptive analysis, which helps predict future events and indicate possible actions. BI reporting can show that the number of departing customers increased in the last quarter. Predictive analytics will help determine which customers may leave in the next month, and prescriptive analytics will tell you what actions to take to prevent this.
Both approaches complement each other. A well-designed BI infrastructure creates a foundation on which to build more advanced analytics and make decisions based not only on what has already happened, but also on what may happen in the future.
4. Basic elements of a BI reporting system
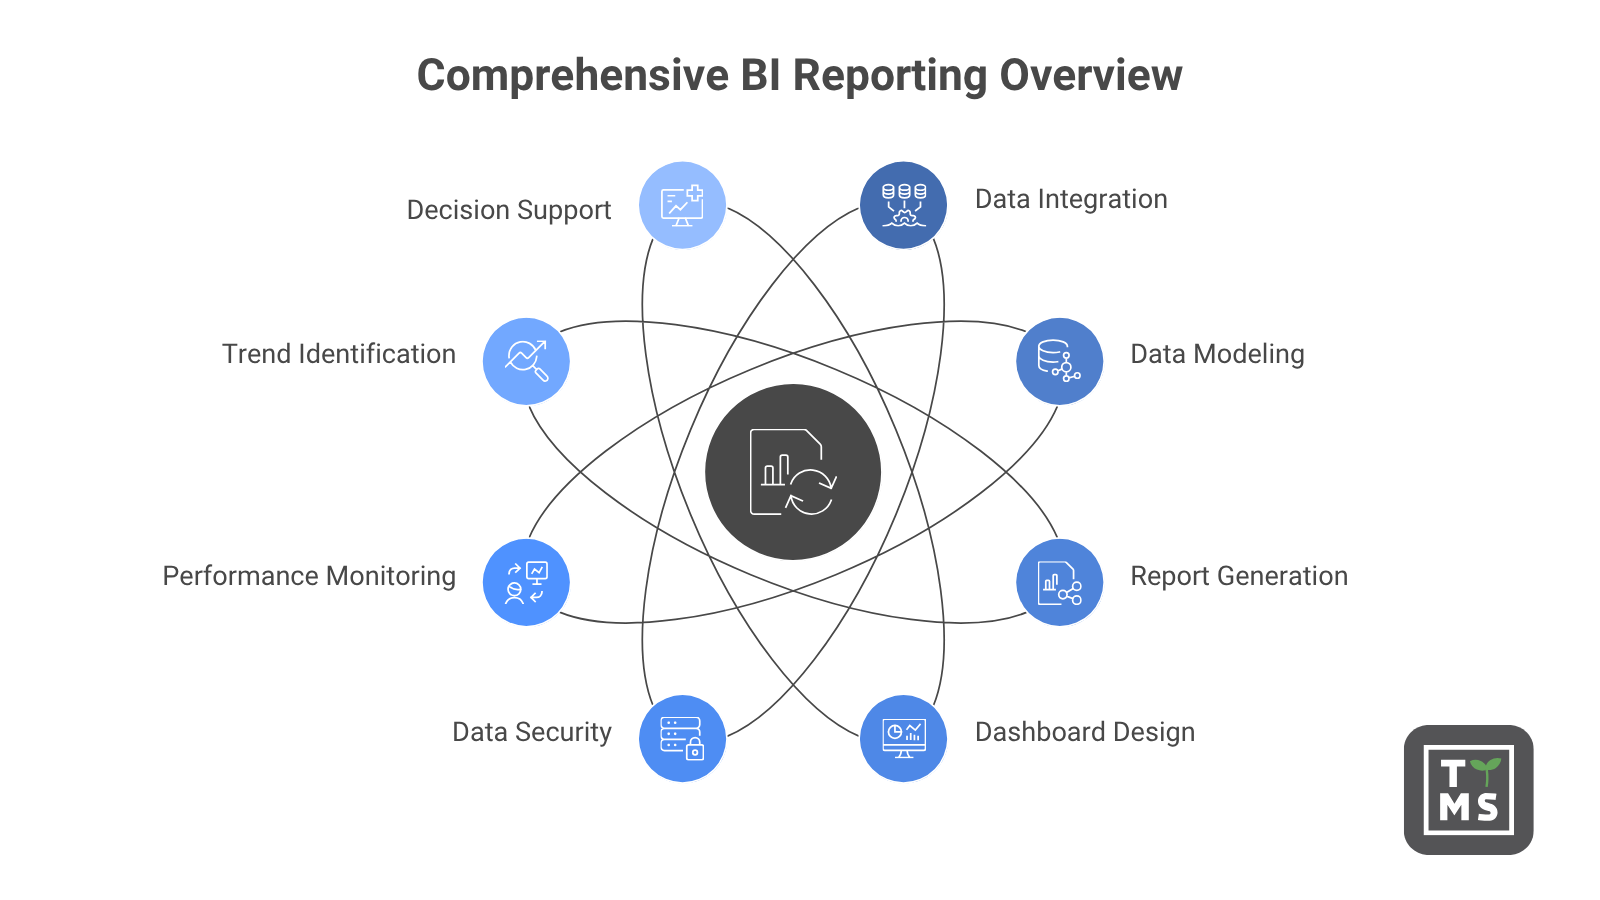
A modern BI reporting system is much more than a set of charts and tables. It is a layered architecture of interconnected components, each of which is responsible for a different stage of working with data – from its download, through organizing and securing, to presenting it in the form of clear reports.
Such a system consists of, among others, data sources, integration processes, data model, security layer, visualization tools and report distribution mechanisms. Only when they are combined can you provide reliable and actionable information to the right people at the right time.
In practice, the problem begins when sales, finance, and operations count the same KPI in three different ways. A good BI environment should sort out this chaos. This allows sales, finance, operations, and marketing teams to work on the same definitions, metrics, and reports, rather than creating their own versions of the truth in separate spreadsheets.
It is also worth checking right away whether the solution will not stop at the first 50 users or when connecting another source system. A BI reporting system should grow with the organization: support new data sources, new users, new business areas, and increasingly advanced analytics needs.
4.1. BI Reports
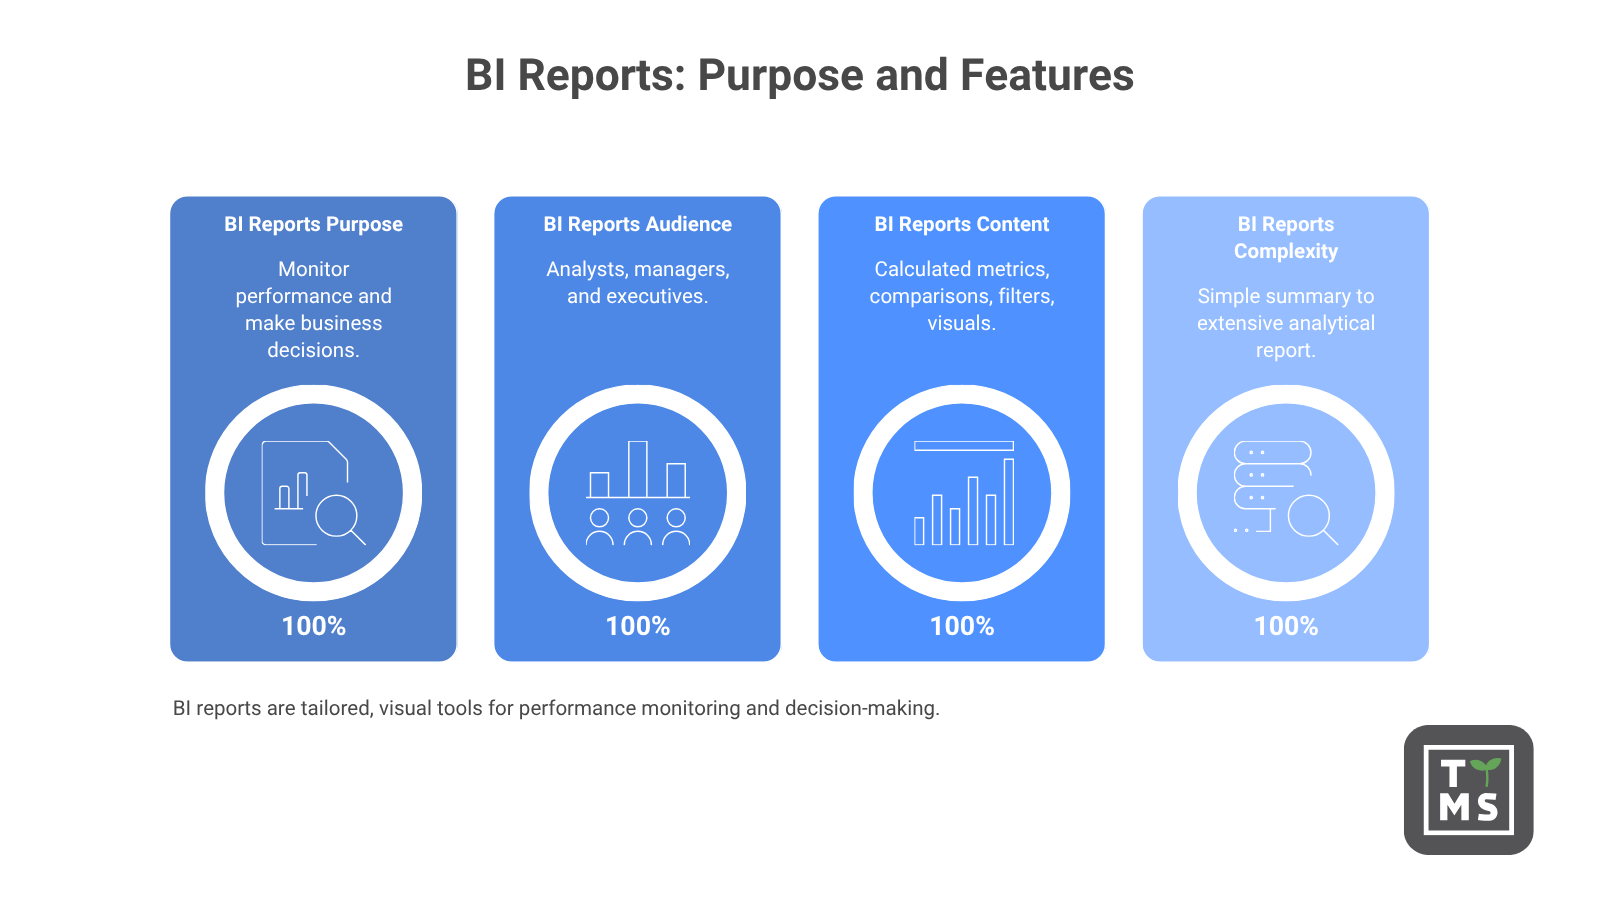
BI reports are structured statements that analysts, managers, and executives use to monitor performance and make business decisions. Unlike simply exporting raw data, a BI report is designed with specific audiences, their needs, and goals in mind.
It can include calculated metrics, comparisons, filters, data slices, and visuals that help you quickly understand the most important information. This means that you don’t have to analyze big data on your own or build your own reports from scratch.
A BI report can be a simple, one-page summary of key KPIs or an extensive, multi-page analytical report with the ability to drill down into detail. Its scope and level of complexity should always result from the real needs of the recipients and the decisions that the report is intended to support.
4.2 Dashboards
The main point of contact for users with the BI system are dashboards. They provide a quick overview of key performance indicators by consolidating key metrics into a single, interactive view.
A well-designed dashboard doesn’t try to show everything at once. Instead, it presents the right information at the right level of detail, with a clear visual hierarchy. This allows users to quickly spot problems, deviations from the goal, trends, and potential business opportunities.
Modern dashboards are increasingly tailored to specific roles in the organization. A CEO may need a synthetic view of strategic KPIs, while a regional sales manager will use a more operational view of performance, sales funnel, or meeting goals in a given region. Both people can work on the same data model, but receive information presented in a way that suits their tasks and responsibilities.
4.3 Data visualization
Data visualizations translate numbers into forms, colors, and layouts that the human brain processes faster than lines of text or complex tables. Charts, maps, scatter diagrams, and heat maps help you see the structure of your data: trends, anomalies, dependencies, and outliers that might go unnoticed in the table.
Well-designed visualizations are one of the key elements of an effective BI platform. They are not only used to present data aesthetically, but above all to understand it. Thanks to interactivity, users can filter information, analyze details and discover dependencies on their own, instead of just passively reading ready-made statements.
4.4. OLAP and Ad Hoc Queries
OLAP, or Online Analytical Processing, enables multidimensional analysis of data in different cross-sections at the same time. In practice, this means that you can analyze, for example, revenue by region, product category, sales channel and period within one consistent model.
Ad hoc queries complement this functionality by allowing business users to ask new questions without having to wait for the next report to be prepared by the IT department. Thanks to this, data analysis becomes more flexible and better suited to the current needs of the business.
When self-service data exploration is based on an ordered semantic model, your organization gains the best of both worlds: central control over metric definitions and the freedom for different teams to analyze data. This allows you to maintain reporting consistency while speeding up decision-making.
5. Types of Business Intelligence Reports
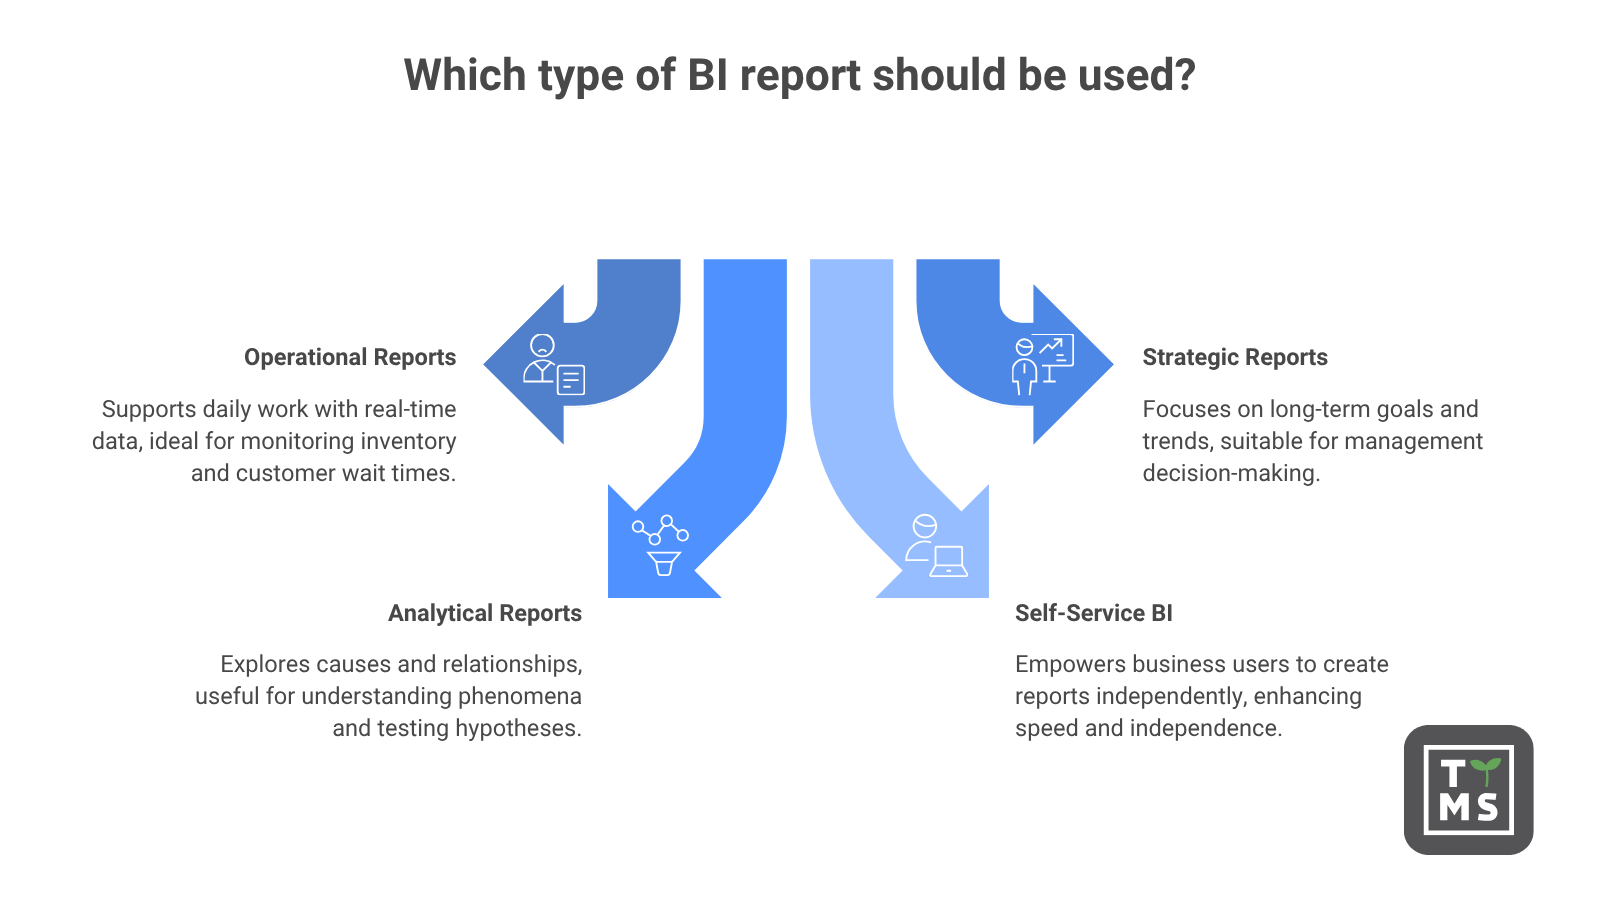
Not all BI reports have the same function. Organizations use a practical division of reports according to their recipients, time horizon and the type of questions they are supposed to answer.
- Operational reports support the daily work of teams. They are based on data that is refreshed frequently or almost in real time. They can help the warehouse manager monitor inventory levels and the call center leader track the wait time of customers in the queue.
- Strategic reports are designed with management and a long-term decision-making perspective in mind. They typically span quarters or years, focusing on revenue trends, segment profitability, business objectives, and market changes.
- Analytical reports are more exploratory in nature. They help you understand the causes of phenomena, test hypotheses, and analyze relationships, for example, through cohort analysis, sales funnel analysis, or root cause analysis.
A separate category is self-service BI, which is tools and environments that allow business users to create queries, reports, and visualizations on their own without the constant involvement of the IT department. This direction is becoming increasingly important as organizations expect faster access to information and greater independence for teams to work with data.
Self-service BI works best when it’s based on an ordered semantic model and certified datasets. This allows companies to reduce the bottleneck on the part of analysts while maintaining consistency in definitions, data quality, and reporting reliability.
6. Examples of the use of Business Intelligence in different departments of the organization
BI reporting is not a tool for one department. Each feature makes data-driven decisions, and real-world implementations show what is truly achievable.
For example, a mid-sized healthcare provider in the U.S. implemented a centralized reporting solution based on Power BI, which replaced the operational reporting previously conducted in spreadsheets. The preparation time for monthly reports has been reduced from about 5 days to less than half a day, or about 90%. On the other hand, management queries that had previously been answered for several days could be handled on the same day.
Similar effects can be achieved in the manufacturing sector. One manufacturing company has rebuilt its reporting in Power BI, by introducing automatic data refresh and standardized reporting models. As a result, the reporting time at the end of the month was reduced by 60-70% and the costs of overtime related to manual data preparation and merging were significantly reduced.
A professional services company that integrated Power BI with CRM, PSA, and financial systems reduced the time it takes to prepare weekly reports on resource utilization and pipeline by 30-40%.
Access to near-current data on billing hours also allowed for better monitoring of the level of consultant utilization and faster response to deviations. This translated not only into time savings, but also into a real impact on revenues.
In practice, the greatest value of BI reporting is not the mere reduction of manual work. More importantly, however, the organization can make more accurate decisions faster based on current, reliable data.
On the infrastructure side, retail and e-commerce organisations benefiting from Snowflake and Power BI achieve a 20-25% cost reduction for analytical computing by separating BI workloads into a dedicated virtual warehouse with auto-suspend functionality.
This approach has also improved the responsiveness of dashboards during peak hours, as BI queries have stopped competing for resources with data retrieval and processing processes.
The effect was twofold: lower infrastructure costs and a more stable user experience using reports and analytics dashboards.
TTMS cooperated with customers who faced similar issues related to data fragmentation: multiple disconnected source systems, inconsistent metric definitions across departments, and reporting cycles counted in days rather than hours.
The repeatable pattern is clear here: a well-managed Power BI semantic model, properly integrated into the customer’s data environment, solves the problem of metric consistency first, and only then saves time.
In one such project, consolidating reporting under a single managed model eliminated conflicting margin definitions that previously led to recurring disputes between finance and commercial teams.
Sales and marketing teams use BI dashboards to connect spend to pipeline performance and revenue. This replaces distributed reporting in spreadsheets with one consistent view that updates automatically. In each case, the basic mechanism remains similar: manual, fragmented reporting is replaced by a connected and managed BI layer. This not only saves time, but also improves the quality of decisions made based on data.
7. Key Benefits of BI Reporting
The business case for investing in BI reporting is confirmed by independent market research. Study The Total Economic Impact™ of Microsoft Power BI conducted by Forrester Consulting showed a 366% return on investment (ROI), a 2.5% increase in operating revenue, and 125 hours of savings per year for each BI user. At the same time, the workload of analytical teams decreased by 42%.
In practice, most organizations see the benefits of BI in three places: faster decisions, less manual work, and greater trust in data. The first is better decision-making. When leaders have access to up-to-date, reliable, and structured data, they can assess the situation faster, identify risks, and choose actions based on facts rather than intuition.
The second important benefit is greater operational efficiency. Automated data flows reduce the time previously spent manually retrieving, combining, and formatting information. This allows teams to focus on analysis and recommendations instead of preparing subsequent versions of spreadsheets.
BI reporting also supports organizational cohesion. Common dashboards, standardized metrics, and a single data model keep different departments working on the same version of the truth. This reduces data accuracy disputes and allows you to focus on making business decisions.
Finally, BI strengthens strategic planning. Access to trend data, segmentation, and scenario analysis helps executives spot opportunities and threats earlier. That’s why organizations are increasingly treating BI reporting not only as an analytical tool, but also as a way to standardize decision-making processes, improve management, and reduce costly disparities between departments.
8. The biggest challenges of BI reporting and the causes of project failures
The path to effective BI reporting is associated with real obstacles. Therefore, it is worth talking directly about why BI initiatives fail, instead of limiting ourselves to a general list of potential challenges.
Research on the failure of BI projects in enterprises consistently points to two layers of problems. The first includes strategic errors: unclear business goals, poor support from the board of directors, or the lack of an owner responsible for defining key metrics. The second concerns the implementation of the project itself: low data quality, uncontrolled expansion of the scope of work and insufficient training of users. According to available analyses, 57% of BI deployments exceed budget or schedule due to lack of control over the scope of the project, and 55% of users do not trust BI tools due to insufficient training.
Problems related to data management are particularly harmful. Gartner warned that by 2027, 80% of data governance initiatives will fail, and the cause will most often be a lack of responsibility on the part of the business, not the technology itself. When no one is responsible for clearly defining terms such as “revenue”, “margin” or “active customer”, each team begins to understand them differently. As a result, trust in the BI platform decreases, regardless of how well the data model is designed. This is one of the most common barriers that TTMS observes in organizations investing in BI tools but not achieving the expected adoption.
Another recurring pattern of failure is starting a project with the choice of a tool rather than deciding which reporting you want to support. Organizations that create dashboards before defining business questions, decisions, and expected outcomes often end up with reports that look impressive but don’t change the way teams operate. BI built around available data, and not around important decisions, becomes a reporting exercise, not a real decision support system. It is the prioritization of results rather than effects that is one of the most frequently cited causes of failure in practitioners’ research and analytical literature.
TDWI Survey they also point to the complexity of data integration as a major technical hurdle. Organizations that underestimate the difficulty of connecting legacy systems, SaaS applications, and distributed databases often encounter months of delays in BI projects. The source of these delays are integration works that have never been properly planned.
Competence gaps further reinforce this problem. TDWI’s benchmark research indicates that the chronic shortage of BI specialists, data engineers, and analytical translators remains a permanent constraint for organizations looking to develop or modernize their BI capabilities.
The solutions are structural. Establishing clear responsibility for metrics before choosing a tool, including data governance in the first sprint instead of treating it as a second-phase task, and matching BI investments to the actual level of maturity of the organization significantly increase the chances of successful implementation.
9. How to Build an Effective BI Reporting Strategy
A BI reporting strategy that delivers long-term business value requires more than choosing the right tool and loading data. In projects that develop over several years, BI usually ceases to be an “implementation”. It becomes a product that is developed similarly to a business application – with a backlog, owner and subsequent iterations.
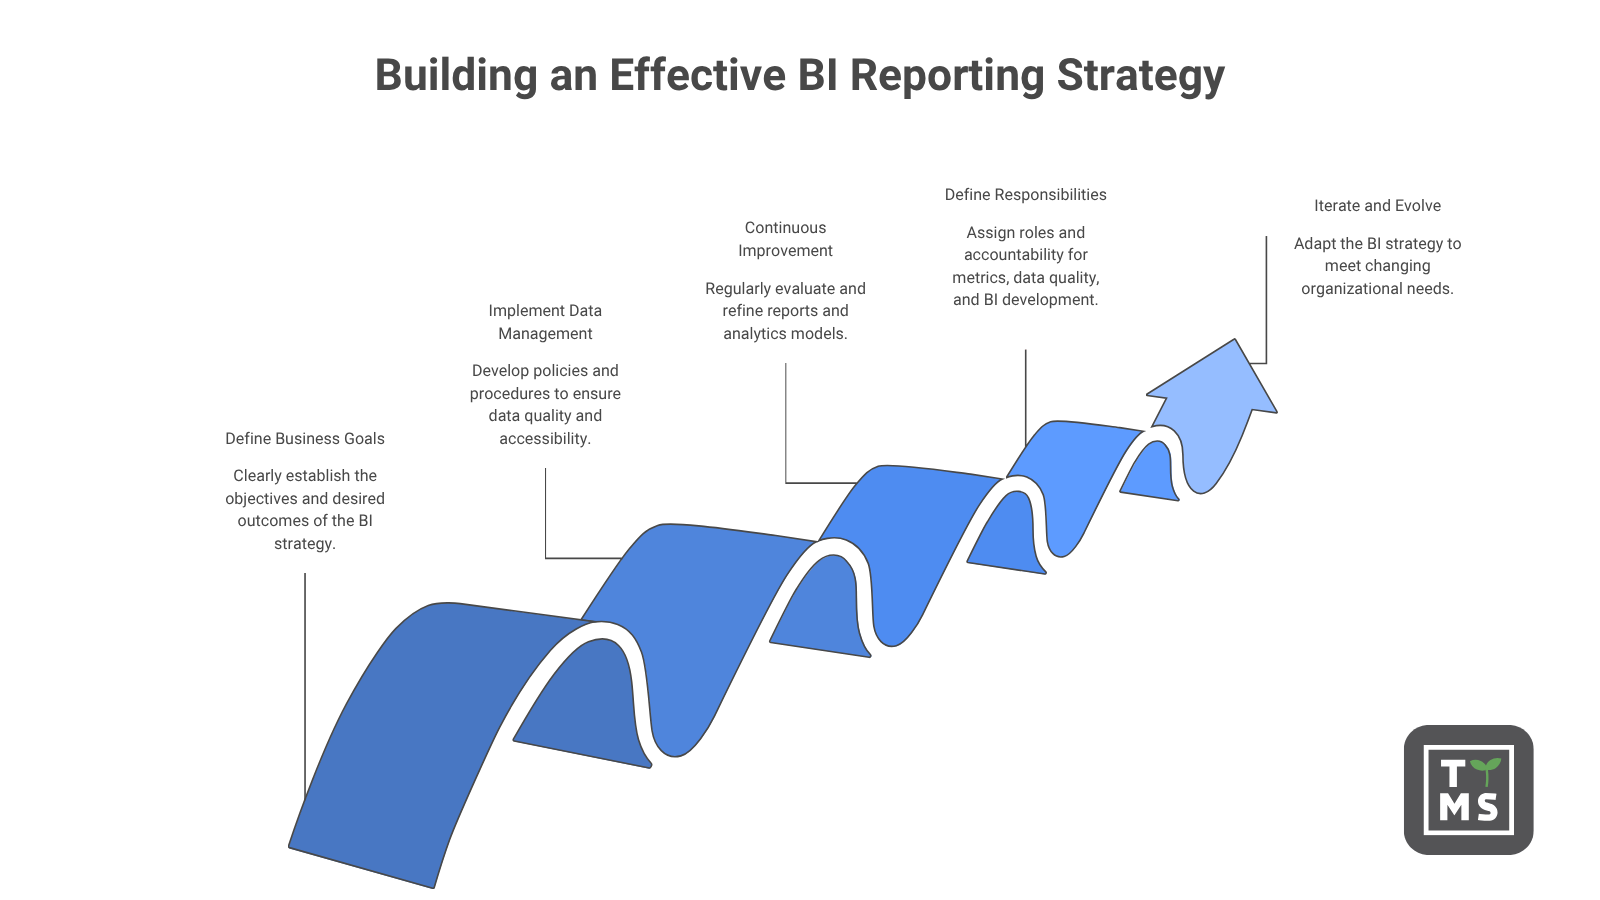
This approach requires clearly defined business goals, appropriate data management policies, and continuous improvement of reports and analytics models. It is also crucial to define responsibilities for metrics, data quality, and the development of the BI environment. This allows reporting to evolve with the changing needs of the organization, rather than quickly losing relevance.
The most effective BI strategies assume continuous iteration from the beginning. Reports are regularly evaluated for their relevance, and new business needs are gradually incorporated into data models and dashboards. Thanks to this, the reports do not end up as nice dashboards that no one looks into. They become a tool for making specific decisions.
9.1. Define goals and success metrics before you start working with data
The first and most important step is to determine what success looks like before an organization opens up any BI tool. It is worth pointing out three to five decisions or processes with the greatest impact on the business that need improvement. This can be pricing policy, customer churn reduction, delivery planning, sales pipeline management, or financial closing process.
For each of these areas, you need to determine how BI reporting can realistically improve outcomes. It’s best to put it as a value hypothesis, based on measurable KPIs. This allows an investment in BI to be evaluated with the same accuracy as any other business initiative.
TDWI’s research shows that many organizations don’t have a clearly defined data and analytics strategy at the enterprise-wide level. This leads to ad hoc BI projects, inconsistent tools, and duplication of the same reporting activities across different teams. Starting with clearly defined goals helps avoid this fragmentation.
9.2. Data environment audit and organization maturity assessment
Before designing any BI solution, it’s a good idea to reliably assess the current state of your data environment. Such an audit should include data quality, completeness of integration, maturity of management rules, organizational structure and team competencies.
In organizations with a lower level of maturity, the priority should be the basic foundations: data integration, creating a single version of the truth, and implementing key KPI dashboards. Only on this basis can more advanced reporting and analytical capabilities be safely developed.
In organizations with higher maturity, the scope of activities may include advanced analytics, self-service BI, and reporting embedded in business applications. Trying to skip earlier stages often leads to costly errors, low adoption, and a lack of trust in data.
9.3. Choose a BI tool that fits your organization’s needs
Tool market Business Intelligence it is mature and very competitive today. Among the most frequently chosen platforms for large organizations, Microsoft Power BI, Tableau, Qlik and Cognos are regularly mentioned. Each of these solutions offers slightly different capabilities in terms of self-service analytics, data management, integration into the corporate ecosystem or the use of AI-based features.
TTMS supports customers in building modern analytical environments, using Microsoft Power BI as part of a partnership with Microsoft and the Snowflake platform as a data storage and processing layer. This approach allows you to create a consistent environment covering the entire process – from the collection of raw data, through its integration and modeling, to interactive reporting and business analysis.
The choice of the right BI tool should primarily result from the needs of the organization. It is worth evaluating the ease of use for target users, the ability to integrate with existing systems, the level of security and data access management, the scalability of the solution, and the availability of AI-supported features.
Data governance mechanisms and consistency in metric definitions are also becoming increasingly important. In modern BI environments, they are no longer additional features, but one of the key criteria for choosing a platform. It is these data that determine whether an organization will be able to build trust in data and use it effectively in the decision-making process.
9.4. Design reports with your audience, not just your data in mind
A technically correct report that no one uses is still a failure. That’s why BI reports should be designed around the specific decisions they’re meant to support, rather than just around the data available in the organization.
Executives need a synthetic view of trends and key KPIs. Operations teams expect quick access to up-to-date information about the current situation. Analysts, on the other hand, need the ability to drill down, filter data, and explore on their own.
Efficiency is also an element of a good reporting project. Users expect dashboards to respond quickly, and response times will be counted in single seconds rather than long waits for a view to load. If a report is slow, its adoption decreases, even if it contains valuable data.
9.5 Manage, monitor, and continuously optimize your BI environment
BI management is an ongoing practice, not a one-time task performed at the beginning of a project. It includes defining and enforcing common metrics, managing role-based access, tracking data lineage, auditing report usage, and deprecating content that has become outdated or duplicates existing solutions.
One of the most effective structures supporting the long-term quality of reporting is the BI Center of Excellence, which is a small, cross-functional team responsible for standards, good practices, user support and management of the BI environment.
Data on the use of reports should feed the BI development backlog. This allows the organization to prioritize critical improvements, remove repetitive reports, and respond faster to changing business needs.
10. BI Reporting Best Practices for 2026
The most important BI reporting practices for 2026 reflect a broader shift in the approach to analytics. Organizations are moving away from passive dashboards created mainly by IT departments in favor of analytical environments supported by AI, self-service and real business decision-making needs. Five practices are particularly important.
The first is to treat BI as a managed self-service product. This means building a central analytics platform with a product owner, backlog, and roadmap, while providing business users with the ability to create analytics on their own based on certified and managed datasets.
The second practice is to standardize the semantic model and the reusable metrics layer. When terms such as “revenue,” “customer churn,” and “active customer” are defined once and used consistently across the organization, the company reduces data fragmentation and strengthens trust in reporting.
The third practice is to embed AI-powered analytics into key workflows. Natural language queries, automatic anomaly detection or analysis of the main factors influencing results are no longer an experiment, and are becoming an expected element of modern BI implementations.
As the TTMS points out in its analysis on the AI in business, 2026 will be a period of greater responsibility for investments in artificial intelligence. Experiments conducted between 2023 and 2025 must translate into measurable business results, stable management and greater cost discipline. The same direction will also affect the development of BI environments.
The fourth practice is to design BI around decisions and actions, not the dashboards themselves. Reporting should be as close to day-to-day operational processes as possible to shorten the gap between gaining insight and taking action.
The fifth practice is user-centered design. Performance, availability, responsiveness, and convenience of cross-device reporting should be considered as basic requirements, not add-ons. Even the best-designed visuals won’t increase adoption if the reports load too slowly or are difficult to use on a daily basis.
11. How TTMS can help with BI reporting
For organizations that are in the early stages of BI implementation, TTMS starts with the foundations: data integration, structured semantic model, and KPI reporting. The goal is to create a single version of the truth on which the effectiveness of all subsequent analytical activities depends.
For organizations ready to scale, TTMS expands the BI environment with self-service layers, role-aligned dashboards, embedded analytics, and Snowflake-based data warehouses. This approach allows you to separate BI workloads, improve reporting efficiency, and better control infrastructure costs.
At every stage, TTMS combines technical competence with experience in change management. This helps to reduce the gap between a well-designed BI system and the solution that users actually use in their daily work.
Talk to a TTMS BI professional about your current data environment and check where to start.
What is BI reporting and how is it different from regular reporting?
BI reporting is the process of collecting, organizing, modeling, and presenting data in the form of interactive reports and analytics dashboards. Its goal is to support business decisions based on up-to-date, consistent and reliable information.
Unlike traditional reporting, which often relies on static statements and manually prepared sheets, BI reporting integrates data from multiple sources into one regularly refreshed model. This allows users not only to read the results, but also to filter the data, analyze details, and search for answers to subsequent questions on their own.
What is Business Intelligence reporting used for?
Business Intelligence reporting is used to monitor performance, track KPIs, identify trends, and support business planning. It helps organizations better understand what is happening in sales, finance, marketing, operations, customer service, or other areas of business.
In practice, BI reporting can support both day-to-day operational decisions and long-term strategic planning. It all depends on how the data model is designed, what reports will be made available to users, and what decisions you want to make with them.
What do BI reports mean for business users?
For business users, BI reports mean access to up-to-date, trusted data in a form tailored to their role and daily decisions. They don’t need to know SQL, data architecture, or the technical details of source systems to use valuable insights.
A well-designed BI report allows managers, specialists, and team leaders to independently analyze results, check for deviations, filter data, and react faster to changes. In many cases, it gives business users analytical capabilities that previously required the support of a dedicated analyst.
How to implement BI reporting in a company?
Successful BI reporting implementation starts with defining business goals and success metrics. Next, it’s a good idea to audit your existing data, choose the right platform, build a structured semantic model, and design reports with specific audiences in mind.
Equally important are the processes of management, security, monitoring of data quality and continuous optimization. TTMS supports organizations at every stage of the process—from Power BI deployment and Snowflake, to data integration and report design, to training, user adoption, and managed services.
What are the most commonly used BI reporting tools?
Some of the most commonly used BI reporting tools include Microsoft Power BI, Tableau, Qlik, Cognos, and data platforms such as Snowflake, which support storing, processing, and sharing data for analytics.
The choice of tool should depend on the needs of the organization, the existing infrastructure, security and management requirements, the number of users, and the level of complexity of reporting. The platform alone is not enough – data quality, a consistent semantic model, the right metrics and real adoption on the part of business users are also crucial.