On 10 September 2026, OpenAI announced ChatGPT for Financial Services, a solution combining GPT-6 Astra with professional financial data sources and tools for preparing analyses. The product was developed in collaboration with Morgan Stanley and Evercore. It is designed for financial institutions, with an initial focus on investment banking and equity research.
It allows analyst teams to find data, perform calculations and prepare client materials in one place. This could reduce the time spent gathering information and transferring it between tools.
In this article, you will learn:
-
- what data and features ChatGPT for Financial Services offers,
- what preparing a company analysis with GPT could look like,
- why metric calculations and data sources need to be checked,
- which stages require an analyst’s review,
- how to assess whether implementation is worthwhile for your company.

How does ChatGPT for Financial Services support analysts?
Materials published by OpenAI and its data providers describe several specific use cases:
- Comparing companies. Daloopa, a provider of company financial data, makes selected data and metrics available for comparing business performance. Source references help analysts verify where the figures come from.
- Finding companies that meet specific criteria. Daloopa also describes searching for companies by business activity or geographical region. The resulting list can provide a starting point for further market analysis.
- Preparing client materials. OpenAI describes creating valuation models, research notes and presentations using company templates for Excel, Word and PowerPoint.
ChatGPT for Financial Services provides access to selected data from Daloopa, PitchBook, LSEG News and Crunchbase.
OpenAI is also developing integrations that will allow institutions to use data covered by their existing subscriptions. These include S&P Capital IQ, LSEG, MSCI, Dow Jones Factiva and Moody’s.
From data to company analysis: five steps in the workflow
Let’s walk through preparing a comparison of two industrial companies ahead of a client meeting. The analyst needs to assess profitability, explain material differences and prepare a short note with a results table. Using fictional data, we will show what to check during a pilot, from selecting information to approving the final material.
1. Defining the question and scope of the comparison
First, we establish which period to compare: the last full year, a six-month period or the trailing twelve months. We also check whether the figures cover the entire corporate group or an individual company, which currency they use and how each metric was calculated. In our example, we use consolidated data for both groups for the same calendar year. Amounts are stated in millions of euros.
Before comparing results, we need to check the start and end dates of the reporting periods. One company’s financial year may end in December, while another’s ends in March. The documentation for the US SEC’s EDGAR database also highlights these differences. The analyst must then decide how to account for the mismatch and whether additional data is needed. The agreed approach should be recorded in the instructions for the AI and included with the completed analysis. This gives the model clear guidance and helps the reviewer understand which data was compared and why.
2. Gathering data and identifying its sources
For each important figure, record the company and period it relates to, the units used and how it was calculated. A reference to the specific table or explanatory note in the report is also needed. Keeping the source document and its retrieval date makes it easier to review or update the analysis later. According to OpenAI’s description, ChatGPT for Financial Services lets users locate specific tables and document passages, highlighting the information used in the analysis.
In our example, we compare EBITDA, or earnings before interest, taxes, depreciation and amortisation. The reviewer should be able to trace a reported value back to the company’s report and check how it was calculated. This also allows them to confirm that the figure covers the correct period and scope of operations.
3. Aligning definitions before comparing margins
Companies may report adjusted EBITDA that excludes selected costs. These adjustments increase the value of the metric. Before comparing profitability, it is therefore necessary to check which adjustments have been applied. The US SEC also highlights differences in how individual companies calculate financial measures.
Let’s look at two fictional companies. We assume that both calculate EBITDA before adjustments using the same principles. Company A then adds back EUR 4.59 million in costs that it excludes when calculating adjusted EBITDA. As a result, the metric rises from EUR 27.57 million to EUR 32.16 million. Company B has no such costs, so its figure remains unchanged.
Illustrative example. Consolidated data for the same calendar year. Amounts are stated in EUR million.
| Item | Company A | Company B |
|---|---|---|
| Revenue | 229.73 | 183.78 |
| EBITDA before adjustment | 27.57 | 23.89 |
| Costs excluded when calculating adjusted EBITDA | 4.59 | 0.00 |
| Adjusted EBITDA | 32.16 | 23.89 |
| EBITDA margin before adjustment | 12% | 13% |
| Adjusted EBITDA margin | 14% | 13% |
After the adjustment, Company A’s margin is 14%, exceeding Company B’s margin of 13%. Before the adjustment, Company B has the higher margin: 13% compared with 12%. In this example, the treatment of costs determines which company has the higher EBITDA margin. The analyst should therefore check which costs make up the EUR 4.59 million adjustment and whether they also occurred in previous years. This helps them assess whether excluding these costs is justified for the analysis being prepared. They can also present both scenarios and explain the difference to the client. AI can help gather data and recalculate margins, while the expert assesses whether the adjustment is justified and how it affects the conclusions.
4. Verifying calculations in the spreadsheet
In our example, simply divide EBITDA by revenue: 27.57 ÷ 229.73 gives a margin of approximately 12%, while 32.16 ÷ 229.73 gives approximately 14%. The displayed amounts are rounded; the spreadsheet should retain full precision for its calculations. More complex analyses may require currency conversion, alignment of reporting periods or the preparation of several forecast scenarios. The reviewer should be able to trace each of these steps. It is therefore worth asking AI to create a spreadsheet in which source data, assumptions and formulas are clearly separated. The analyst can then check the calculations and see how changing a single value affects the result.
To test the spreadsheet, you can halve the adjustment, reducing it from approximately EUR 4.59 million to EUR 2.30 million. Company A’s adjusted EBITDA should then be approximately EUR 29.86 million, with a corresponding margin of 13%. These amounts are rounded for presentation; the spreadsheet should calculate the change using unrounded values. After making this change, check the comparison table and the commentary on the results as well. Both companies would now have the same margin, so the conclusion that Company A has a higher margin would need updating. This is a simple way to assess whether the calculations and accompanying text remain consistent.
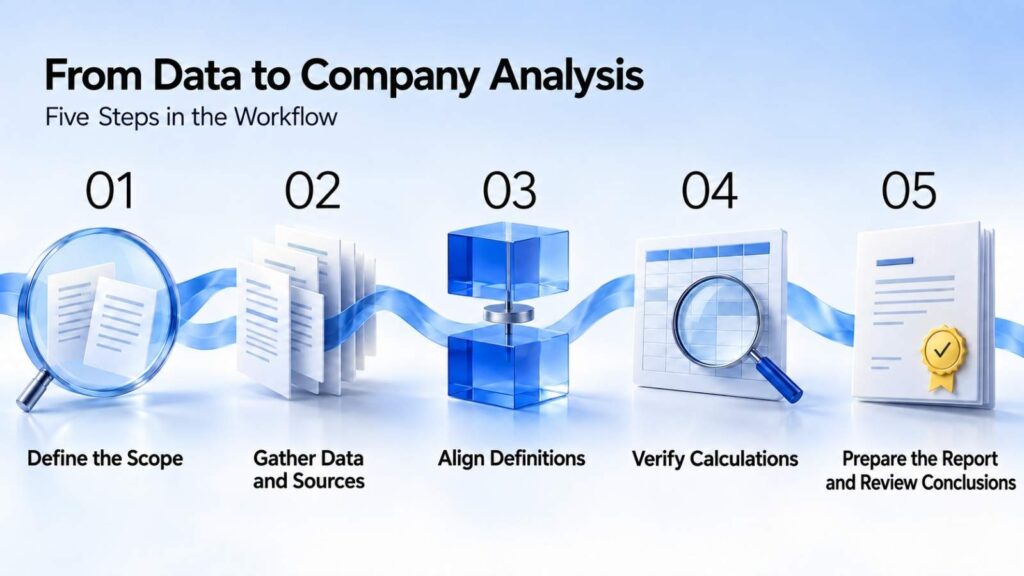
5. Preparing client materials and reviewing conclusions
The completed analysis can be presented in the company’s preferred format. According to OpenAI’s description, an administrator can share Excel, Word and PowerPoint templates with the team for the tool to use when creating documents and presentations.
In our example, the client should receive a results table and a short explanation of how the cost adjustment affects the margin comparison. The expert reviewing the material checks whether the conclusions match the calculations and answer the client’s question. If anything needs clarification, they can request a further explanation or another version of the analysis. Time measurements should also include reviewing the material and making corrections before approval.
How can you protect data and preserve a record of the analysis?
When preparing a client analysis, the team may use public reports, paid databases and confidential documents. It is necessary to establish who can access this information, where it will be stored and who can receive the finished material.
According to the ChatGPT Work security documentation, business data is encrypted and is not used to train models by default. Data retention periods, processing locations and the scope of recorded activity depend on the settings and connected services. Before implementation, check which user and tool actions are logged and which records can be exported.
During the pilot, keep the source documents, successive versions of the spreadsheet and the final material, together with a record of who approved it and when. Then check whether this documentation allows you to reproduce the calculations and trace the approval of the analysis. Separately, verify whether system logs allow user and tool activity to be traced to the extent required by the company.
How can you assess whether implementation is worthwhile?
Start by choosing a task the team performs regularly, such as updating a company comparison after quarterly results are published. Before testing, measure how long this analysis takes using the existing method and define its quality requirements. These findings will provide a baseline for comparison with AI-assisted work. The time needed to review and correct the analysis must be added to the preparation time. OpenAI highlights this in its guidance on assessing the business value of AI, also recommending that implementation and ongoing usage costs be included. In practice, it is worth comparing:
| Metric | What does it tell us? |
|---|---|
| Time from starting the task to approving the analysis | Does the client receive the finished material sooner? Include waiting time between stages. |
| Total time spent by the analyst and reviewer | Does the team spend fewer hours on preparation, review and corrections? |
| Number of errors affecting the results or conclusions | Does the analysis meet the same quality requirements as the existing approach? |
| Accuracy and completeness of source references | Can the origins of key figures and information be verified? |
| Time needed to update the analysis | How efficiently can new data be incorporated and the calculations and conclusions that depend on it be updated? |
| Cost per approved analysis | What is the cost of the finished material, including team time, the tool, data and the share of implementation and maintenance costs allocated to that analysis? |
The test should cover several tasks of varying difficulty. Define the assessment criteria before it begins. Someone performing the same analysis for a second time already knows the data and some of the answers, which may shorten the time needed. It is therefore worth using comparable tasks and varying the order in which participants work with AI and with the existing method.
If AI saves time, check how the team used it. They may have prepared more analyses, responded to clients sooner or reduced overtime. The implementation assessment should show separately how the time saved was used and whether company spending decreased, and by how much.
When is it worth starting a pilot?
Consider a pilot if the team regularly gathers data from multiple sources and updates similar analyses. Choose a task that takes analysts a significant amount of time, such as comparing data from company reports. Assign a person to lead the pilot and experts to review the results. If the team only occasionally analyses a few annual reports, check whether tools already approved for use within the company are sufficient. Where data retrieval and calculations are already automated, identify a specific task that the new tool could improve.
OpenAI makes the product available to financial institutions that meet its access requirements and directs interested companies to its sales team. Pricing, detailed terms and availability for a particular institution in Poland must be confirmed with the provider. Availability information. The implementation decision should be based on the pilot results: the quality of the analyses, the time needed to prepare and review them, and the total cost of the work. The test will also show whether the tool provides access to the data the team needs.
Want to explore where AI could improve analysts’ work in your organisation? Talk to the TTMS team about choosing a task for a pilot, connecting the necessary data sources and assessing the results.

How does ChatGPT for Financial Services differ from analysing reports in ChatGPT?
ChatGPT for Financial Services provides access to selected professional financial data directly within the tool. It also supports references to specific tables and document passages, as well as the preparation of materials using company templates. When assessing its suitability for a team, check whether the available sources cover the companies, periods and metrics the team needs.
Does ChatGPT for Financial Services require separate financial data subscriptions?
Selected datasets are included in the product. These cover some of the information supplied by the providers named by OpenAI. The company is also developing integrations intended to let institutions use data covered by their existing subscriptions. Before purchasing, confirm which data is included in the offering and which requires additional access rights.
Can ChatGPT for Financial Services be used to analyse companies listed on the Warsaw Stock Exchange?
This depends on the availability of data for individual companies. Check whether the tool provides their financial statements, relevant metrics and historical data. The launch announcement alone does not confirm full coverage of the Warsaw Stock Exchange. The best way to assess the product’s suitability is to test it on several companies the team regularly analyses.
What should you do if data from ChatGPT differs from the figures in a company’s report?
Start by comparing the sources, reporting periods, units and definitions of the metrics. A discrepancy may arise, for example, from using standalone rather than consolidated financial data, or from including EBITDA adjustments. Also check whether the company has published an updated report. The analyst should explain the discrepancy and document which value they used and why.